I have spent the past two years researching swing trading, a method I consider to be the optimal balance between effort and gains. My journey began with Kristjan Qullamaggie, a legend in the trading world, who introduced me to one of his esteemed teachers, Pradeep Bonde. Within this influential group, I discovered Dr. Mansi, whose ability to simplify and articulate complex trading systems stands out as exceptionally clear and insightful.
I spent a lot of time looking at the details and ended up with over 70 pages of Dr. Mansi's explanations. I've simplified it since then. As a joke, I wrote it as a book and asked Dr. Mansi if I could put it online. So here it is:
Thanks for reading Ney’s Substack! Subscribe for free to receive new posts and support my work.
Entry Setups: Breakouts and pullback buys are the primary entry setups used.
Breakouts involve finding stocks that have shown momentum and are consolidating, then entering when they break out on high volume.
Pullback buys involve waiting for a stock to pull back to a moving average before entering.
Three Possible Scenarios: Stock gaps up, fades, or stays below the previous day's high in the morning.
When entering a stock in the morning, there are three scenarios: a stock gaps up, a stock fades for the rest of the day, or a stock stays below the previous day's high.
ATR for Stop Loss: Stop losses should be placed below the day's low and limited to less than 1-1.2 times the stock's ATR.
Use Average True Range (ATR) to determine stop loss levels based on the stock's volatility. Stop losses should be below the low of the day and should not exceed 1-1.2 times the stock's ATR.
Volume Buzz and News: Volume Buzz helps assess a stock's trading volume relative to its average, and news can provide additional context for making trade decisions.
Use Volume Buzz to gauge how much a stock trades compared to its average volume, which helps make informed trading decisions. Combining Volume Buzz with the news can provide valuable insights for managing trades effectively.
2 Entry Strategies
There are 3 scenarios you can face:
*h1 = previous day's high. She uses that nomenclature because of coding in TC2000. It could easily be confused with “first hour” or “hour 1”.
1st scenario is “Gap up”
Gap-Up Scenario: In this scenario where the stock opens significantly higher than its previous day's closing price, creating a "gap" on the chart. The trader waits for the first five minutes of trading and enters the stock when it breaks above the high of that five-minute opening range. This breakout indicates strong buying interest in the stock, and the trader sets a stop-loss at the low of the day.
Ney’s comment: It took me a while to understand this; I kept hearing “enter at the Open range high (ORH).” What it means is: “Wait 5 mins for entry. Only enter if the price breaks above the high created in the first 5 mins.” We do this to minimize fake breakouts.
2nd scenario “Crosses Previous day's high in the first 5 min.”
The previous day’s high is broken. We still respect the entry at minute 5.
The exception to the 5 min entry: We only enter in minute 1 in a raging bull market or a big catalyst.
*h1 = previous day's high.
3rd scenario: “Stays below the previous day’s high”
“Stays below the previous day’s high” in the first 5 minutes.
In this scenario, the stock remains below the previous day's high during the first five minutes of trading. The trader observes this behavior and sets an alert or places a limit order at the level of the previous day's high. If the stock eventually breaks out above this level later in the day, the trader gets alerted or filled, allowing them to enter the trade at the desired pivot line. This approach gives the trader more time to plan their entry and assess the stock's performance before entering.
By looking at the Rvol value, the trader can get an indication of whether the stock is experiencing higher or lower than usual trading volume.
The importance of using Rvol in this context is to help the trader assess the strength and potential follow-through of breakouts. A stock with higher-than-average trading volume during a breakout is considered to have more conviction behind the price move, making it more likely to sustain its upward momentum.
On the other hand, a stock with lower-than-average volume during a breakout might be less reliable and prone to fading or reversing.
By analyzing Rvol and considering its relation to the stock's price, the trader can make more informed decisions when entering stocks, especially during breakout scenarios. It helps them identify stocks with high volume participation, increasing the probability of successful trades.
Note from Ney: Rvol is important in Gaps (EP’s) but not necessary in normal breakouts (swing trades), according to my backtests.
Using your list to understand the market mood:
You can create a watchlist and see the average vol as a proxy for market sentiment.
Bear sentiment (go short)
You can see most stocks are going down in volume so it could be a better environment for a short position:
Bull sentiment (go long)
This is a good environment. Stocks are breaking up with volume:
Weak market (stay away).
Ney comment: in summary, Volume serves as confirmation.
RVOL + NEWS
News, just as Volume helps as confirmation.
In the case below, Dr. Mansi was already in the trade. When she saw the news as confirmation, it gave her the confidence to move the stop to break even.
3 STOP Rules
Stop at the day's low.
Different stops for different strategies: episodic pivot (EP) vs. Stocks in play (SIP)
EP = episodic pivot strategy (something changes permanently for the company long term, and the price shoots up pre-market most of the time with a gap and volume).
Ney Notes: Few times, you will recognize news that comes before the market opens (premarket) and decide that you don't want to wait and buy in pre-market. Of course, this is more volatile.
If buying premarket, set the stop loss at the premarket support level.
SIPs = Stocks in play (Stocks that are moving in pre-market, normally based on news).
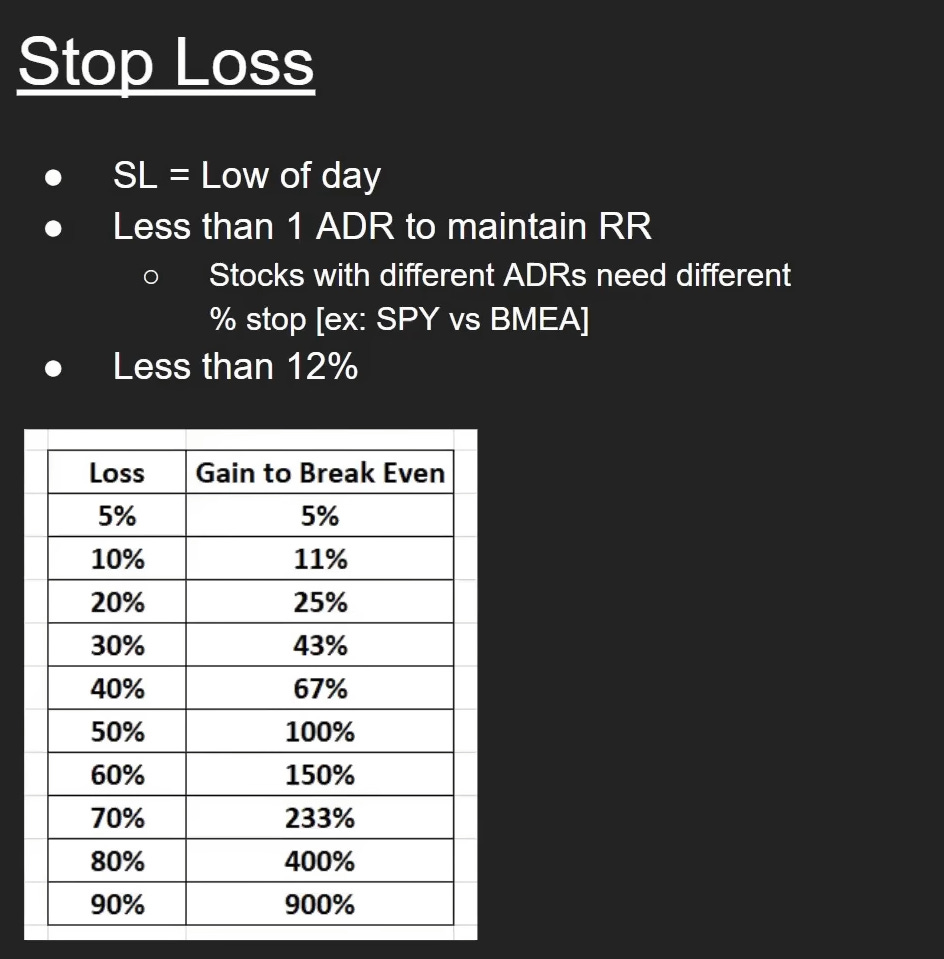
Stop at less than 1 ADR% to maintain the Risk Reward. ADR states how much a stock moves daily. You can also see it as a proxy of how many days it would take to reach a level.
You want to use stops based on ADR/ATR because stocks can be volatile anytime.
A max stop loss of 12% doesn't matter what ADR% it has.
Stop loss is always less than 12% because you need 11% to recover. This is already statistically unlikely for this trading style.
Here is an explanation of the mathematics behind recuperating from losses:
For example, if you lose 50% of your account, you must earn 100% just to break even.
Always set your stops right away (“mechanical”). Don't make them mental stops.
Ney’s comment: I think she later changed to ATR. It stands for average true Range, ATR. ADR is the amount a stock moves in a day ex: “3%,”. On the other hand, ATR measures de same but takes into account gaps. Normally uses a 14-day that's ATR(14). I think she uses ADR%(20), ATR(20). https://www.investopedia.com/terms/a/atr.asp
Thanks for reading Ney’s Substack! Subscribe for free to receive new posts and support my work.
Ok. Now that you know the basics of the mechanics of entry, let’s go to the next level:
Notes: I have spent the past two years researching swing trading, a method I consider to be the optimal balance between effort and gains. My journey began with Kristjan Qullamaggie, a legend in the trading world, who introduced me to one of his esteemed teachers, Pradeep Bonde. Within this influential group, I discovered Dr. Mansi, whose ability to simpl…
The volume buzz definition from TC2000 is the following:
A stock's volume for the current day (let's say at 11:32am) is compared to its average historical volume for the same percentage of the day. The volume buzz tells you how far ahead or behind the stock is based on its normal historical activity. A volume buzz of +250% means the stock is trading 250% more than normal for this portion of the day. A figure of -50% means the stock is trading at only half of its norm for this portion of the day. A figure of 0 means nothing unusual is going on in either direction.
So I think a volume buzz of 1 (or +100%) means the stock is trading at double its normal volume for that specific portion of the day. Essentially, it indicates that the trading activity or volume for the stock is 100% higher than its average historical volume for the same percentage of the trading day.
Or am I missing something?