
How I set up my charts and scans from A complete trading system in your hands: A guide to trading an hour a day"
My notes on Dr. Mansi video series.

Notes:
I have spent the past two years researching swing trading, a method I consider to be the optimal balance between effort and gains. My journey began with Kristjan Qullamaggie, a legend in the trading world, who introduced me to one of his esteemed teachers, Pradeep Bonde. Within this influential group, I discovered Dr. Mansi, whose ability to simplify and articulate complex trading systems stands out as exceptionally clear and insightful.
I spent a lot of time looking at the details and ended up with over 70 pages of Dr. Mansi's explanations. I've simplified it since then. As a joke, I wrote it as a book and asked Dr. Mansi if I could put it online. So here it is:
How I set up my charts and scans
Charts and scans using the TC2000 charting service for US markets.
Link to layout: https://www.tc2000.com/~XAPDvk
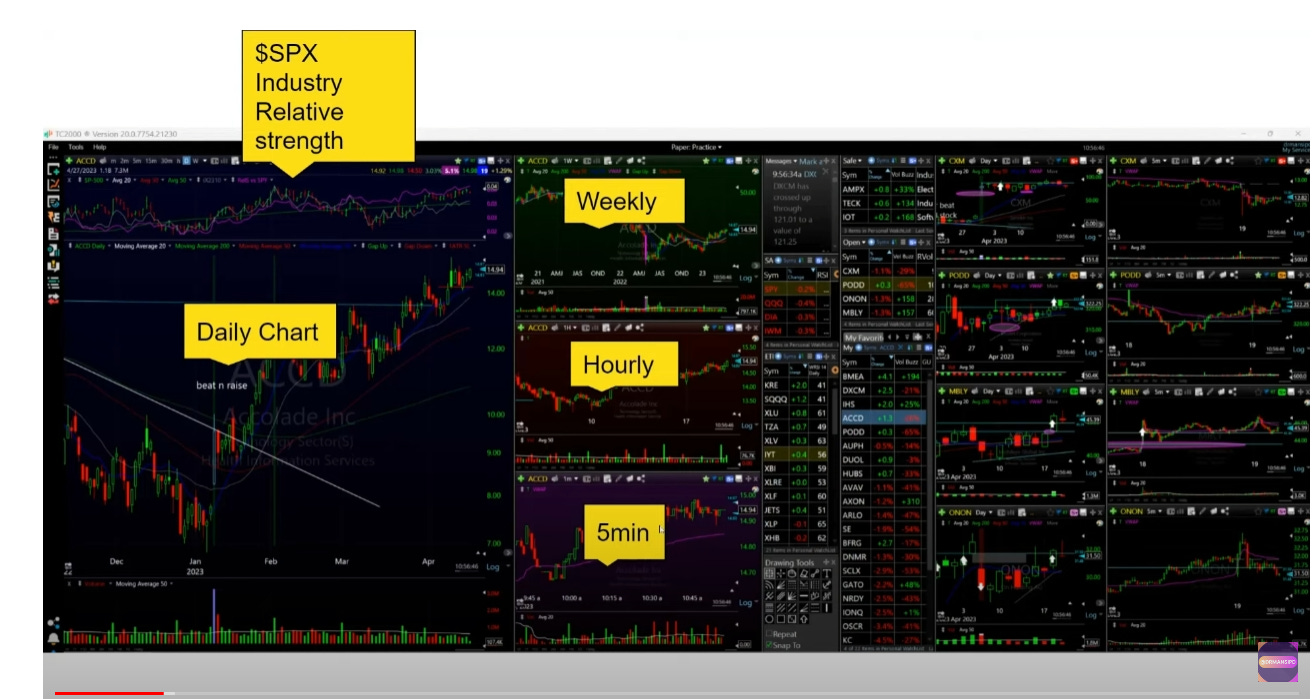
The layout consists of four main sections:
Multiple time frames of a single stock.
Broad market overview with major indices.
Open positions and watchlist.
Daily and five-minute charts of current unsafe positions.
Indicators like relative strength versus the S&P 500 are used for interpretation.
Alerts are set up to notify traders of specific stock conditions.
Safe positions have their stop loss at or above breakeven, while unsafe positions are below breakeven.
Traders closely monitor unsafe positions to manage risk effectively.
How the Chart looks like
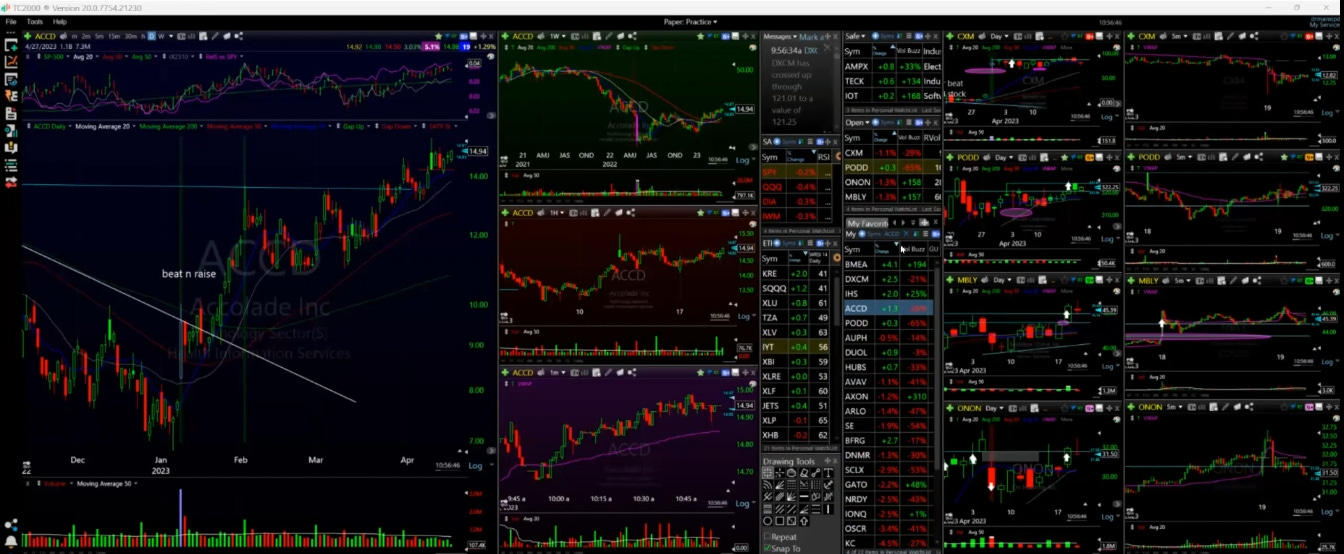
What the chart shows:

Step-by-step explanation of each section:
SPX industry relative strength: shows a market graph (in this case, $SPX). It overlays a gray line showing the industry of the stock you are looking at in the “Daily Chart.” And the pink line is the “relative strength indicator” vs $SPY.
Bars show the $SPX.
The gray line is the sector.
Purple shows the Relative Strengths of the stock compared to the market ($SPX).
On top of the chart, you can see $spx (bars) relative strength vs spy (pink line) and industry group (gray line).
You want to see the Relative Strength of the stock (pink line) going up more than the market (SPX).
You want the stock > industry > market. Pink line> gray line >candles.

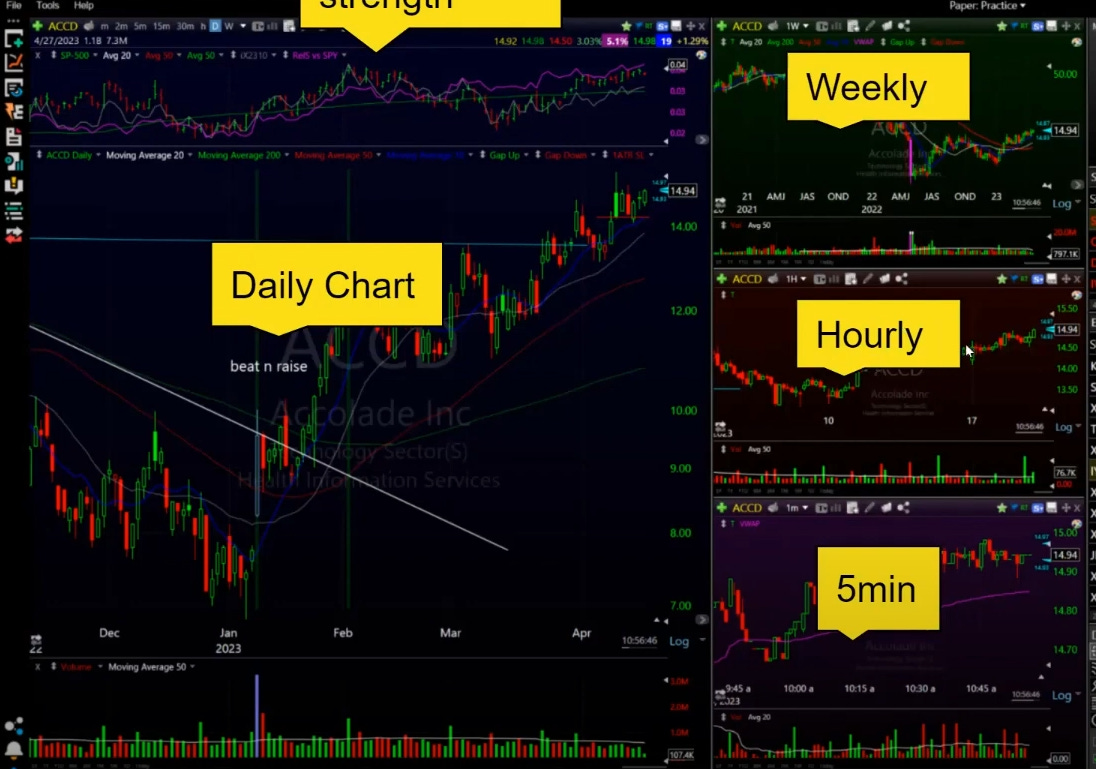
Viewing multiple time frames simultaneously helps traders make trading decisions:
Daily is the most important and where decisions are made
Weekly is for the macro view
Hourly is used for support and resistance levels.
5 min gives the micro view and is used only when buying and selling decisions have been made.
The chart below is now self-explanatory. Safe positions are trades where the stop loss is already at or above breakeven so that you won't lose any money theoretically.
The reason for “Daily charts of unsafe positions”, and “5 min charts of unsafe positions” is to move the stop to breakeven and to develop a feeling of how the market is behaving today.
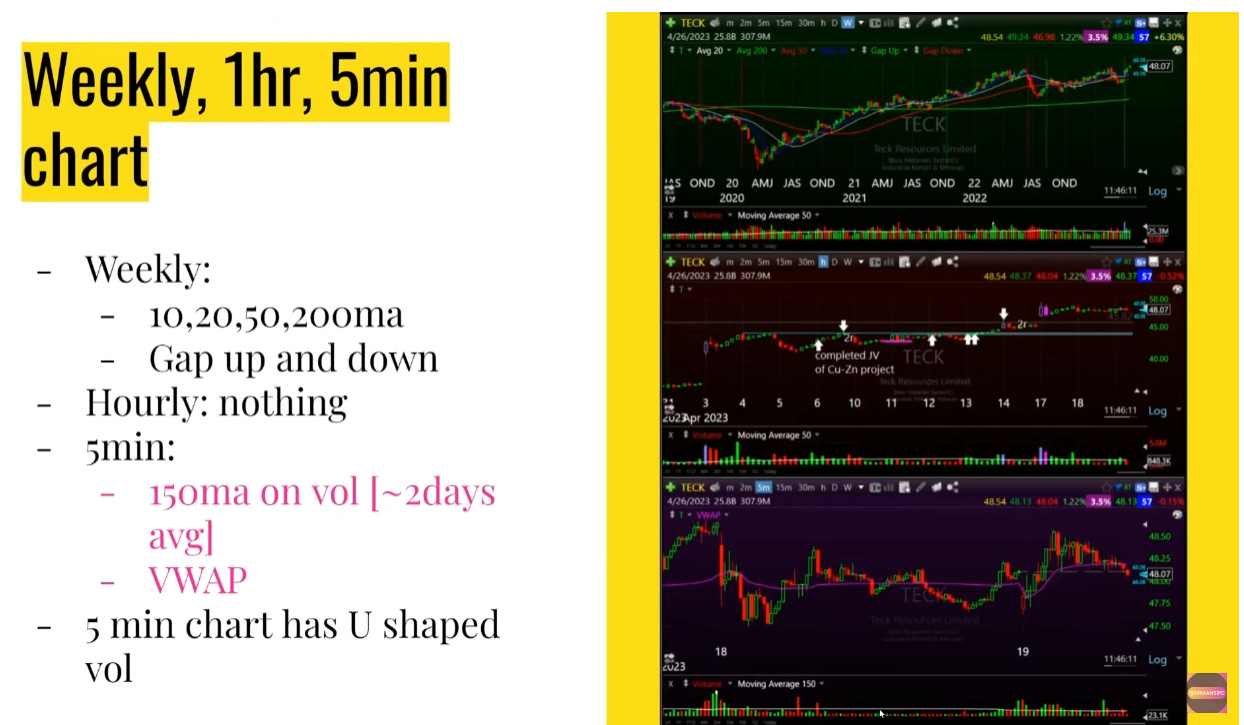
*The moving average was chosen due to its popularity with traders.
An hourly chart is used to draw resistances and supports manually.
In the 5-minute chart, most volume happens in the morning and close, forming a U shape in volume. That’s why she uses a 150-moving average to normalize it.
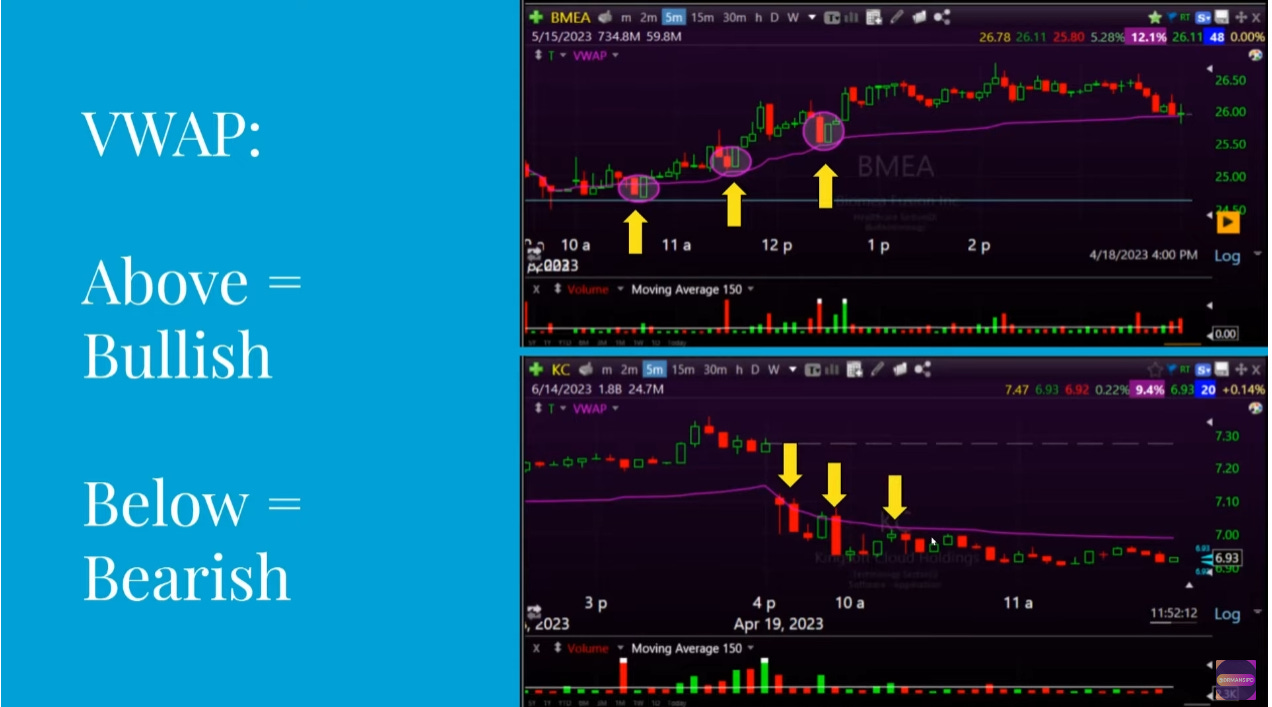
VWAP is used a lot by institutions on intraday trading. We can see how the price bounces from it.

Look if Earnings are coming soon.
Capitalization to see if there is moving potential. The smaller the company, the better.
Average daily volume traded = liquidity. It makes it easier to get in and out. $5M to $10M min.
Specific to her strategy:
Hod = high of the day.
Lod = low of the day.
SL% = stop loss percentage. (where to set the stop)
ADR = volatility. One of the rules is that we don’t want the stop to be more than 1 ADR.
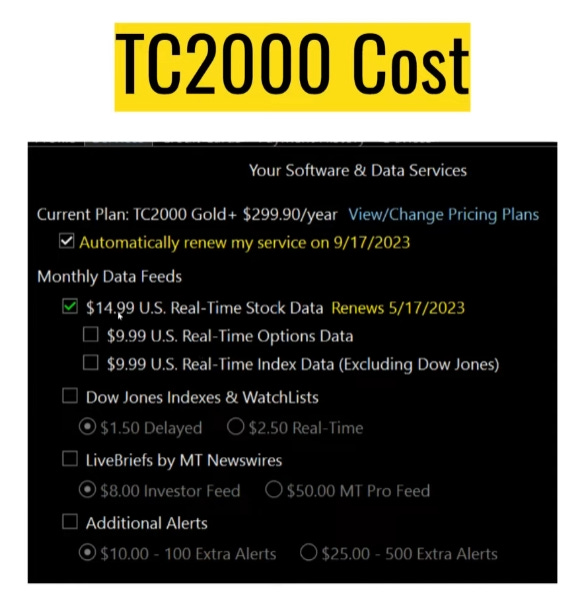
Tc2000 costs
Link to my layout: https://www.tc2000.com/~XAPDvk
Now that you have your charts and scan, we can start with the theory:
When to enter stocks from "A complete trading system in your hands: A guide to trading an hour a day"

Notes: I have spent the past two years researching swing trading, a method I consider to be the optimal balance between effort and gains. My journey began with Kristjan Qullamaggie, a legend in the trading world, who introduced me to one of his esteemed teachers, Pradeep Bonde. Within this influential group, I discovered Dr. Mansi, whose ability to simp…