


Deep dive on Gap trading - How did gaps behaved since 2019?
Episodic Pivots, Gap trading


What we look for is
A gap up.
Huge volume.
A catalyst
In this post we are looking at the gap ups statistically. What is high? normal? low? etc.
How much of a gap is good?
How much of a gap is bad?
I started this week with Gap Trading, also known as Episodic Pivots (by Pradeep Bonde). This strategy involves trading when the price opens with a gap, often accompanied by a significant volume increase due to unexpected events. The key advantage of this approach is the potential for substantial opportunities, allowing you to place large bets, such as 40% or more of your account, while keeping the risk low, around 1% to 3% of the account amount with a stop set at 10% to 20% or $1 distance.
Quick checklist: from Kristjan Kullamägi
Intraday you can use more than 30% of your account in one trade.
No more than 30% of your account overnight in any position (beware of gaps)
Most of my positions are 10-20% of account size.
Risk per Trade 0.25-1% (based on your intuition of how good the market is)
Small account 0.5-1.5%.
EP = episodic pivot strategy (something changes permanently for the company long term, and the price shoots up pre-market most of the time with a gap and volume).
Position trade (like episodic pivot EP’s) = longer-term holding, like months.
Ney Notes: Few times, you will recognize news that comes before the market opens (premarket) and decide that you don't want to wait and buy in pre-market. Of course, this is more volatile.
You need analytical skills to determine if the news will positively affect the price for the long term in an episodic pivot. For example: Are there enough institutions holding it? What market are they in, etc.?
If you need a refresher of how, when to enter these types of trades go to:
How I Sell Stocks from "A complete trading system in your hands: A guide to trading an hour a day"

Notes: I have spent the past two years researching swing trading, a method I consider to be the optimal balance between effort and gains. My journey began with Kristjan Qullamaggie, a legend in the trading world, who introduced me to one of his esteemed teachers, Pradeep Bonde. Within this influential group, I discovered Dr. Mansi, whose ability to simpl…
Here are some examples I traded this week:
BLZE 0.00%↑ 13% GAP, notice the huge volume. $294 Million Market Capitalization

NXT 0.00%↑ 12.5% GAP, 8.8 billion Market Capitalization

APP 0.00%↑ , gap 16.3%, $20 billion Market Capitalization

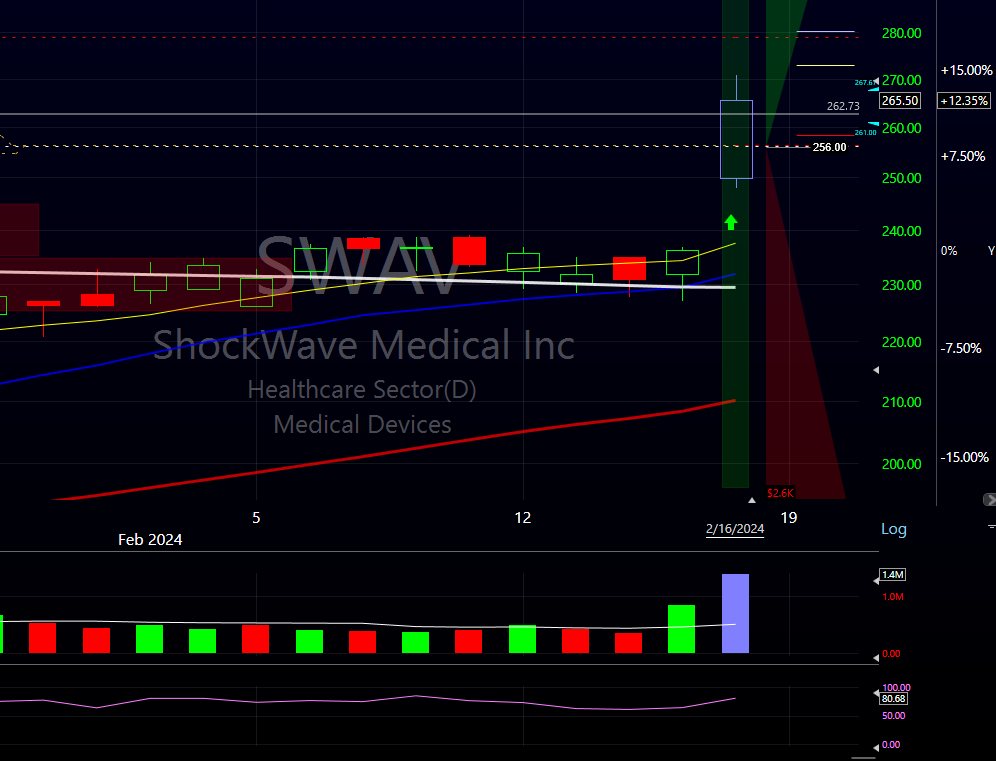
SWAV 0.00%↑ 5.5% Gap, $8.7 billion Market Capitalization
TOST 0.00%↑ GAP 12%, $10.3 billion Market Capitalization

I do want to mention that it is not necessary for a stock to Gap to be an Episodic Pivot or have a change of story. Mostly what identifies this are big bars with tons of volume to indicate that traders are jumping in. For example:

There are many types of EPs:
Earnings and earnings guidance
Government regulations, political stuff
Biotech related like drug trial results or FDA decisions
Macro and political related
…and many more!
The main ones I focus on are earnings and earnings guidance. When a stock reports unexpected, good earnings and guidance, that is often a catalyst for a big and prolonged move.
How do Gaps behave
We are about the analyze every Gap that happened from 2019 - 01 - 01 until 2024 - 02 - 09:
The Median Gap value was 7.14%. Notice how Pre-market volume is just 4.1% of the median volume.
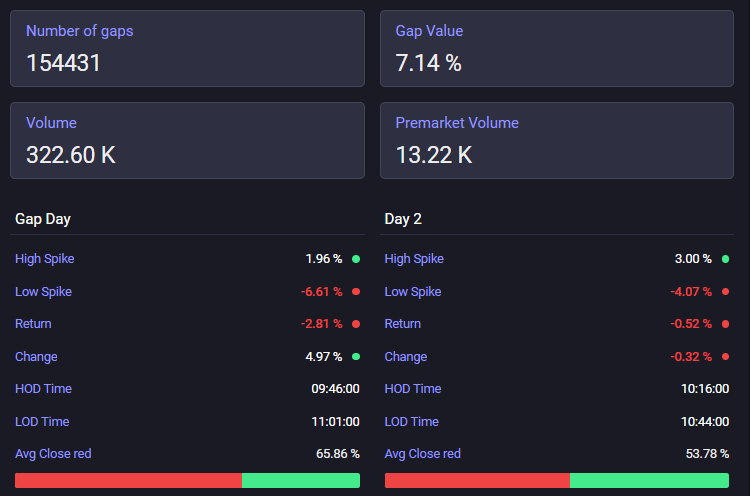
The high of the day was 1.96% at 9:46 am. But the median low was -6.61% at 11 am.
And the odds of red day were 65.86%
if we look at the average numbers:
Gap value was 12.8%. Premarket volume was 12% approximately
The high of the day was 6.15% at 11 am. But the low was -8.12% at 11:51 am

Pre-market high was 16%. Witch means that on average the Gap was bigger in the pre-market.

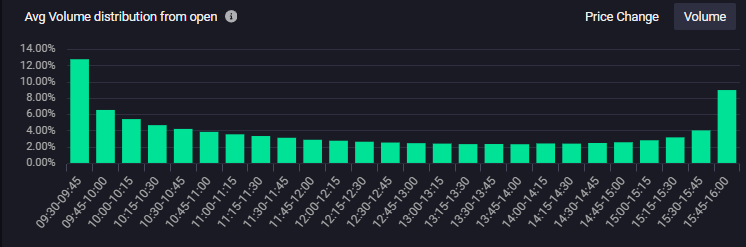
the gap appeared gradually for the first 60 min


So the average gap looks likes this:

Is a 4.13 billion market capitalization US, healthcare stock trading in Nasdaq. With a Premarket volume of 897.02k
Here is the average behavior per month:

Ninety-two percent fo the gaps where under 20%. With 65% chance of closing on red.

13 percent chance it was a $10-$25 stock

Can we geek this up more? sure, we can
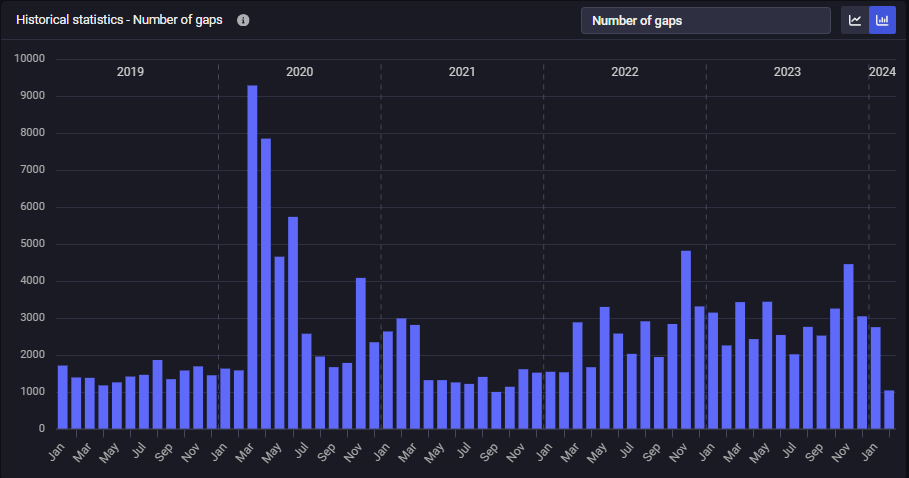
Number of gaps per month

Total Volume per month

Average high spike

average low spike

Returns

Odd of closing red

So far from what we have seen. It would pay off to sell at the market open and close it at the end of the day. With a stop at a 10% high and a profit of - 7%.
But of course, this is just the beginning, stay up tuned for the next posts where I’ll start doing the same research based on market capitalization. I think you will be amazed of the changes in behaviour.