


How a Secret Bond Market Signal Predicts Stock Market Crashes

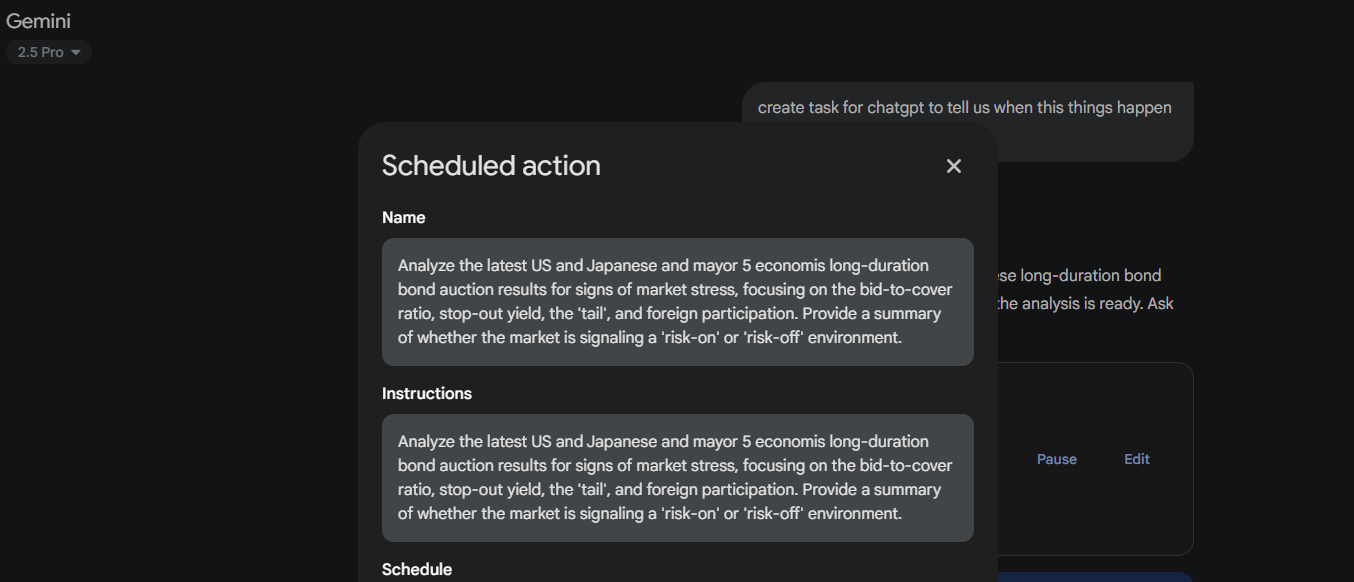
you can schedual AI to tell you and sumarize this things for you
Forget complicated charts. Pro traders are watching one simple event to see market meltdowns coming. Here’s how you can too.
In the high-stakes world of financial trading, everyone is looking for an edge. We're told to watch inflation data, dissect earnings reports, and follow the cryptic pronouncements of central bankers. But what if I told you that one of the most powerful predictive tools is hiding in plain sight, in a corner of the market most retail traders completely ignore?
This isn't about a complex algorithm or some proprietary black-box system. It's about the bond market—specifically, government bond auctions.
Wall Street's "smart money" knows that before a tidal wave hits the stock market, the tremors are first felt in the bond market. The health, demand, and pricing of government debt offer a raw, unfiltered look into the true risk appetite of the world's largest financial players. By understanding how to read the results of these auctions, you can get a crucial head-start on major market shifts from "risk-on" to "risk-off."
Think of it as the market's early warning system. Today, we're pulling back the curtain on exactly what professional traders are looking at.
Deconstructing the Auction: The Four Signals You Can't Ignore
When a government like the U.S. or Japan auctions off its debt (bonds), the results provide a real-time report on the health of the financial system. It’s a simple test of supply and demand. Is there a big appetite for the debt being sold, or are buyers hesitant? The answer lies in four key metrics.
The Bid-to-Cover Ratio: This is the most straightforward indicator of demand. It's the total value of bids received divided by the total value of bonds being offered. A healthy, robust auction will typically have a bid-to-cover ratio above 2.0, meaning there were more than two dollars in bids for every one dollar of bonds for sale. A declining ratio signals waning interest.
The Stop-Out Yield (or High Yield): In a Dutch auction, the "stop-out yield" is the highest yield the government accepts to sell all its bonds. Think of it as the clearing price. A sudden spike in this yield compared to previous auctions is a major red flag. It means the government had to offer a much sweeter deal (a higher interest rate) to attract enough buyers, signaling funding stress and weak demand.
The "Tail": This is a more nuanced, but critical, signal. The tail is the difference between the average yield of all accepted bids and the stop-out yield. A large, or "fat," tail indicates a sloppy auction. It means there was a wide disparity in what bidders were willing to pay, and the Treasury had to dig deep to find enough bids at higher yields. A small, or "tight," tail means demand was strong and clustered around a consensus price. A widening tail is a clear sign of weakening demand.
Foreign Participation (Indirect Bidders): This metric reveals the level of interest from foreign entities, including central banks and international investment funds. When foreign participation drops, it's a powerful signal of global hesitation. It suggests that international players are becoming more risk-averse and are pulling back from funding that country's debt, a potential precursor to a broader flight from that country's assets, including its stocks.
Case Study: How a Japanese Auction Sent Shockwaves to the S&P 500
This isn't just theory. We saw this play out perfectly in recent events.
The Warning Shot: The drama began with a 40-year Japanese government bond auction. The results were nothing short of alarming.
The bid-to-cover ratio was 2.5, the lowest seen since 2012.
The tail was the widest it has been since 1987.
For decades, the Bank of Japan artificially suppressed interest rates. Now, with signs of this policy ending, the market was showing extreme stress. This dismal auction was the "canary in the coal mine," signaling deep-seated problems in one of the world's most important economies.
The Aftershock: Just one day later, the U.S. Treasury held a 20-year bond auction. Spooked by the events in Japan, traders watched this auction with extreme prejudice. The results, while not as disastrous as Japan's, were weak enough to trigger panic:
The stop-out yield came in at 5.047%, higher than anticipated and the highest since October of the previous year.
The bid-to-cover ratio was below average.
The reaction was immediate and violent. The moment the auction results hit the wire, the S&P 500 plunged 60 points in just 10 minutes.
Why? Because the weak auction signaled tighter liquidity. Rising bond yields mean borrowing costs are going up for everyone, which acts like gravity on stock valuations. The bond market told the story, and the stock market had no choice but to listen.
The Trader's Edge: Start Watching the Smart Money
The stock market is often driven by narrative and emotion, but the bond market is driven by the cold, hard math of risk and liquidity. Rising yields and poor auctions mean the financial plumbing is getting clogged. This inevitably leads to higher volatility and downward pressure on stocks.
If you want to anticipate the market's next move, stop looking at where the crowd is today and start looking at where the smart money is placing its bets for tomorrow. Pay close attention to the long-duration bond auctions—the 10-year, 20-year, and 30-year—in both the U.S. and Japan. The results are publicly available on financial news sites.
By tracking the four key metrics—cover ratio, stop-out yield, the tail, and foreign participation—you can build a clearer picture of underlying market health and gain the ultimate edge: seeing the future before it arrives.