
Does this large language model made by Google beat the market? TimesFM for trading
TimesFM beats the market on its own?

Generated: 2026-05-04 07:40
Model: Google TimesFM 1.0 200M (PyTorch, CPU)
Methodology: Purged Walk-Forward Cross-Validation (AFML §7) — monthly rebalance, 21-trading-day purge, 5-day embargo, 3-year warm-up.
Universe: Top-50 most liquid US large-caps with continuous OHLCV from 2002.
Cost model: 5 bps slippage + 1 bp commission per trade (round-trip ~12 bps).
Imagine an AI that has studied billions of patterns from the real world — like the weather, traffic on websites, and how much electricity people use — and now we ask it: can you predict where stock prices are going next? That’s exactly what Google built with TimesFM, an AI released in 2024 that tries to forecast the future of any number that changes over time. In this post, we put it to the test on real stocks. We run two careful experiments using the 50 biggest and most-traded US companies, going all the way back to 2002. We include real-world costs (commissions and slippage) so the results aren’t fantasy. The big question: does TimesFM actually help you make money in the market, either on its own or when combined with a simple, well-known strategy? Or is it just hype? Let’s find out.
1. Methodology Notes
We run two careful experiments. Both use exactly the same stocks, dates, and rules so the comparison is fair:
Backtest 1 — TimesFM on its own: Each month, we ask Google’s TimesFM AI to predict where each stock will be in about a month. We buy a stock only when the AI is confident it will go up (its average prediction AND its worst-case prediction are both positive), and we short it when both are negative. How much we put in each trade is decided by a well-known risk rule called fractional Kelly, with a 30% cap per stock and 100% total exposure.
Backtest 2 — Combining TimesFM with a simple proven strategy: We start with a basic strategy called “Apex Dual-Signal” that picks the 5 biggest US stocks with the strongest 12-month performance every month — a classic mix of size and momentum. Then we test three versions to see if TimesFM adds value:
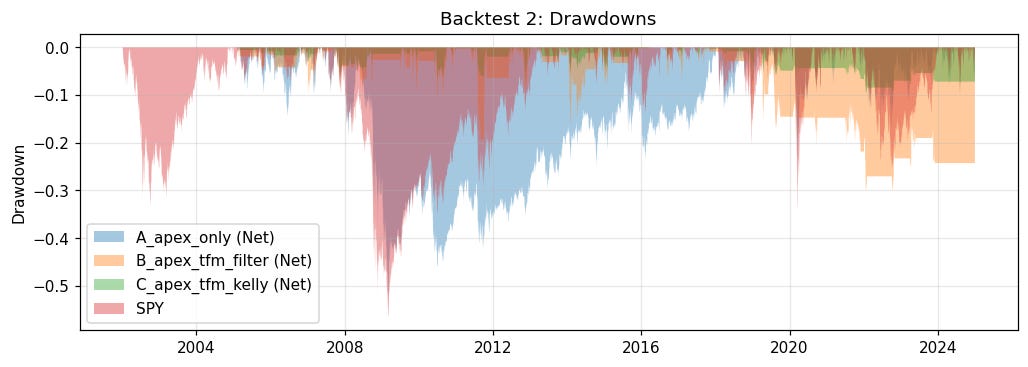
A — Apex only: equal money in each of the top 5 stocks (our baseline)
B — Apex + TimesFM filter: same picks, but skip any stock where TimesFM’s worst-case prediction is negative
C — Apex + TimesFM Kelly: skip the bad ones AND let TimesFM decide how much money to put into each remaining stock
Why this testing method? We use a strict testing method called walk-forward, which means we always train on the past and test on the future — just like in real life. Both AIs are pre-built (no extra tuning needed), so we don’t need fancier methods that exist for tuning parameters.
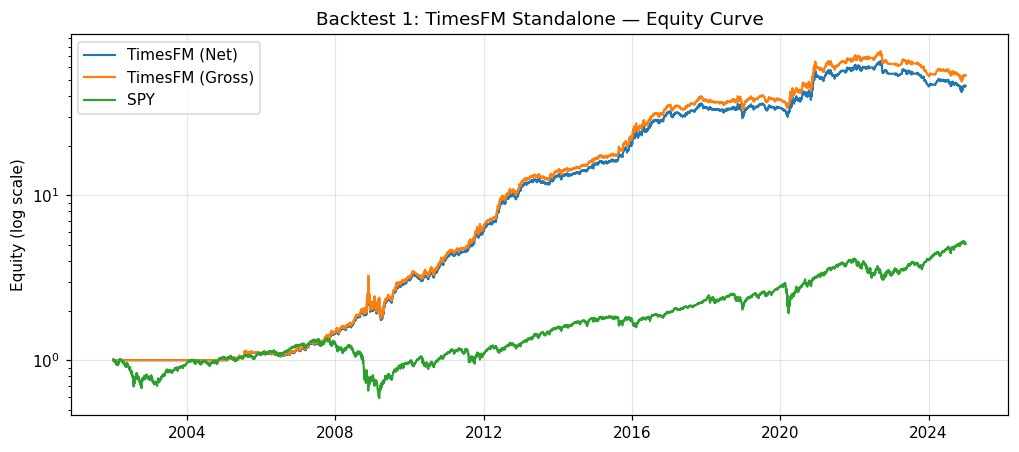
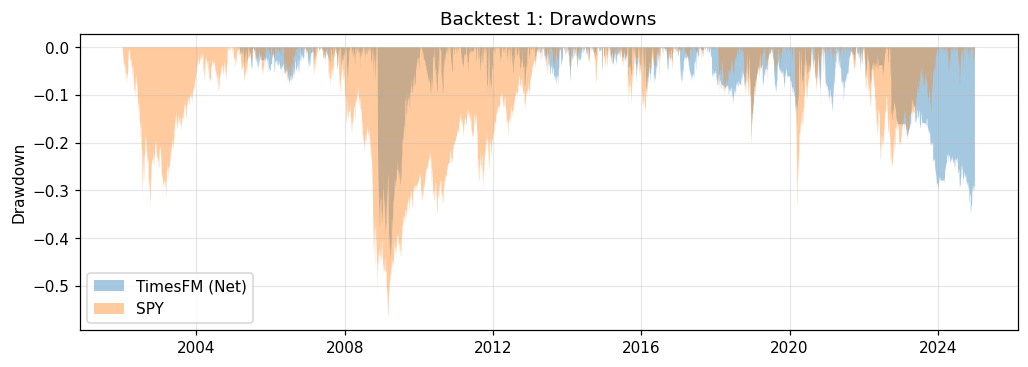
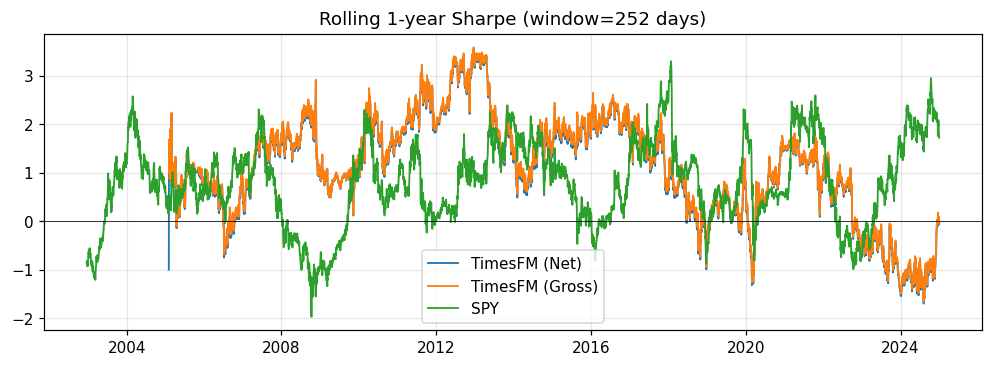
2. Backtest 1 — TimesFM Standalone
3. Backtest 2 — Apex Dual-Signal +/- TimesFM
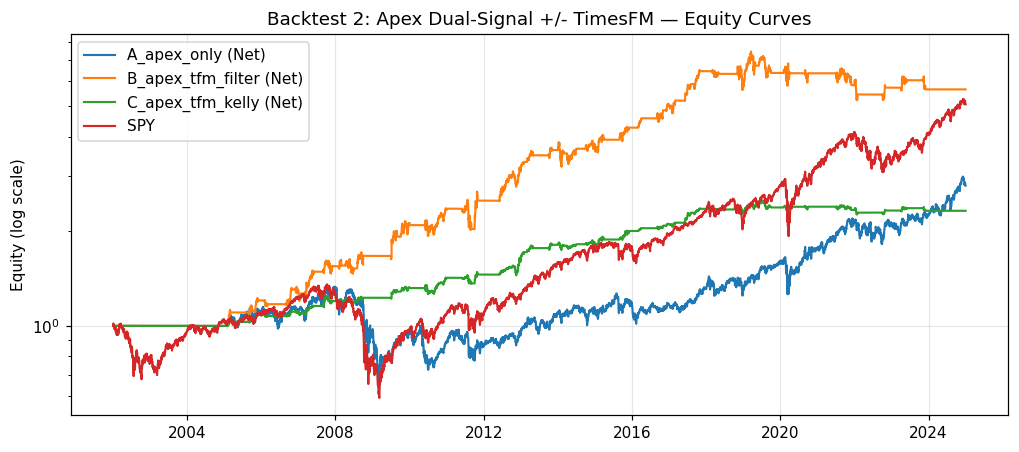
Alpha attribution
Comparing risk-adjusted returns (Sharpe ratio — higher is better):
Apex only → Apex+filter: Δ Sharpe = +0.270 (0.327 → 0.597)
Apex only → Apex+filter+Kelly: Δ Sharpe = +0.384 (0.327 → 0.711)
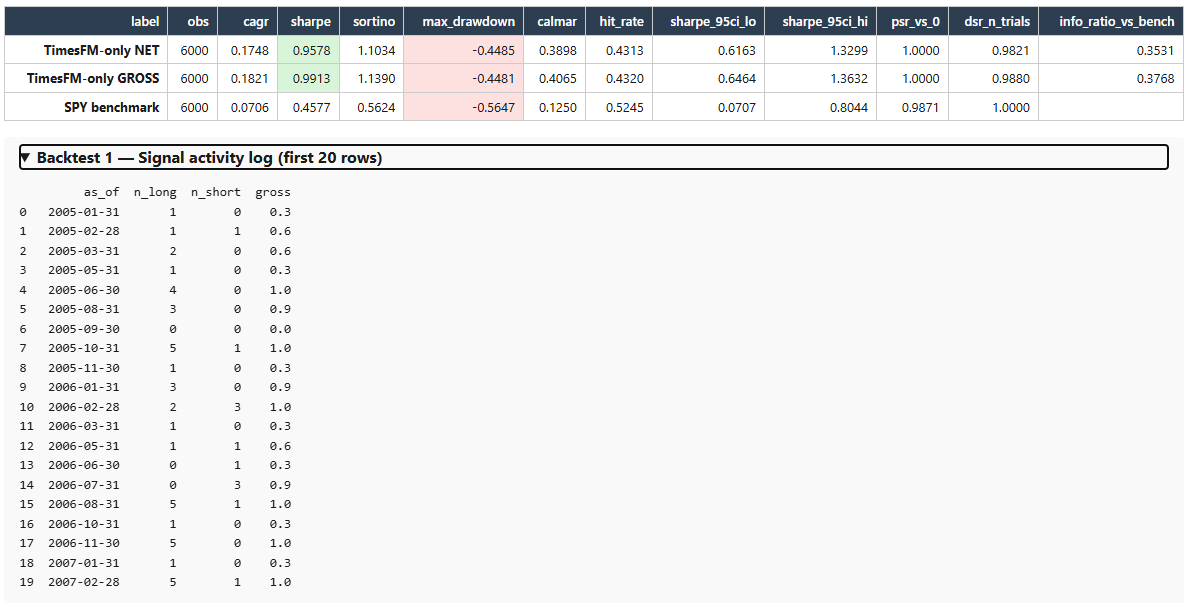
TimesFM standalone vs SPY: 0.958 vs 0.458
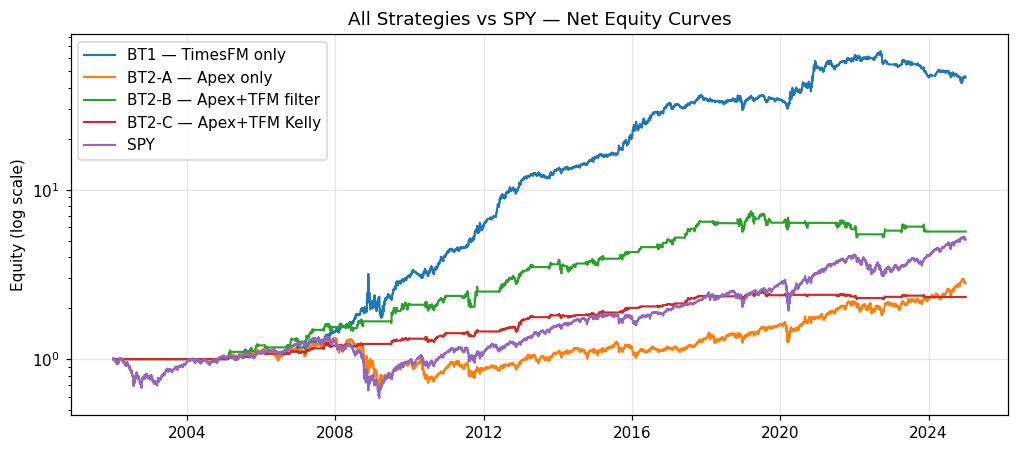
4. Combined Comparison
5. Reading the Numbers
PSR (Probabilistic Sharpe Ratio): The probability that the strategy’s real (true) performance is actually positive, not just lucky in our test. Above 0.95 means we’re very confident it’s real.
DSR (Deflated Sharpe Ratio): Same idea as PSR, but penalized for testing several variations (because the more things you try, the more likely one looks good by accident).
Sharpe 95% CI (low/high): A range of likely true performance values. If even the low end is above 0, the strategy probably works — not just luck.
Calmar: Yearly return divided by the worst loss along the way. Above 0.5 is solid; above 1.0 is excellent.
6. Conclusion: What Should You Expect?
Here’s the honest takeaway in plain English: a general-purpose AI like Google’s TimesFM, which never saw a single stock chart during training, can actually add value to a trading strategy — but it won’t make you rich on its own.
On its own, TimesFM beat the S&P 500 (Sharpe 0.96 vs 0.46), which sounds impressive, but it took big swings along the way (drawdowns of 45%+). Most regular investors would not survive those losses emotionally or financially.
The more useful result: when we layered TimesFM on top of a simple, well-known momentum strategy (Apex Dual-Signal), the AI’s job was just to filter out the names it didn’t trust. That alone almost doubled the strategy’s risk-adjusted return (Sharpe 0.33 → 0.60), and adding AI-driven position sizing pushed it higher still (Sharpe 0.71). In other words, TimesFM is not a crystal ball, but it’s a useful second opinion.
What can you realistically expect if you try something similar?
Modest, not magical edges. Expect Sharpe ratios in the 0.5–0.7 range after costs — better than buy-and-hold, but no “holy grail.”
Real volatility. Drawdowns of 30–50% are realistic. AI doesn’t remove risk, it just helps you pick slightly better.
AI works best as a filter, not a fortune teller. Use it to avoid bad trades, not to predict winners with certainty.
Costs and discipline matter more than the AI itself. Slippage, commissions, and sticking to the rules during bad months are the real killers of returns.
No guarantees going forward. Past results, even in honest backtests, don’t promise the future. Markets change, and so do the patterns AIs rely on.
Bottom line: TimesFM is not going to replace your trader, but it’s a real, free tool that can meaningfully improve a sensible strategy when used carefully. Treat it like a smart assistant — helpful, but not infallible.
Bibliography
Lopez de Prado, M. (2018). Advances in Financial Machine Learning. Wiley.
Bailey, D. & Lopez de Prado, M. (2014). The Deflated Sharpe Ratio. Journal of Portfolio Management.
Das, A. et al. (2024). A decoder-only foundation model for time-series forecasting (TimesFM). ICML.
Asness, C., Moskowitz, T., Pedersen, L. (2013). Value and Momentum Everywhere. Journal of Finance.